In this article, you’ll find out how to group customers with preferences based on the product they are viewing. This will enable you to analyse the preferences and target web personalisation and email communication to these segments. This analysis explains the concept of personalized micro-segments and how to build them. You will learn how to answer questions like, what is the average price range customers are interested in? What are the most popular brands or trending colors on the website for a given customer? Can we see if a customer has a preference for male or female products in a fashion shop?
This analysis is comprised of building an Aggregate, a Customer Segmentation and an appropriate use of Customer Filters. At the end of the article, there are three finished examples of personalized micro-segments for the brand, category, gender and price.
Without at least a month of tracked view_item events with the following attributes (if available) price, gender, brand, category_level_1, category_level2, category_level3, color; this analysis is inaccessible.
Part 1
Description
View_item – this is an event that Exponea tracks to a specific customer, whenever the specific item on the website was viewed. To create personalized micro-segments, you will need at least a month of tracked view_item events.
Next we will choose the property of an event view_item based on which the further analysis is built, for instance, it could be:
- price_interval
- brand
- category
- color
- manufacturer
- vendor
- size
- gender (fashion)
- edition (bookshops)
- country (travel/tourism)
This analysis is comprised of an Aggregate and Segmentation in Exponea and applying it to a Scenario. The aggregate necessary for this analysis in its base form is:
most_common.view_item > attribute = (colour, price interval, brand, category, gender, etc.) > [lifetime]. This aggregate will calculate the most common value among all the view_item events of the attribute in a customer record. At the end of the article, we’ll show you three examples of micro-segments we’ve analyzed and interpreted with this analysis.
For this analysis, it’s also possible to use other events such as purchase_item, cart_update, etc., depending on the proxy for engagement you are looking for. For instance, it can be turned on its head and you can look for categories customers remove most often from their cart (most_common.cart_update, where action = remove attribute = category_level1).
In certain instances it is valuable to consider playing around with the date filter of the aggregate. So for instance with gender-affinity; a male may typically browse the male section, but may also be interested in buying something for their partner as a gift. That is why it could be useful in those instances to set the date filter to [last 14 days] and so allow the website and personalization to be as fluid/dynamic as the customer. Based on their viewing behavior, they could be affected by personalized communication from both categories.
Part 2
Why you should use this analysis
Benefits
Additional useful customer classification. To a certain extent, the browsing behavior of some customers is similar to others. Grouping them based on their activities and preferences will increase the effectiveness of marketing campaigns, since personalized targeting for each micro-segment is being used. For instance, you can classify potential customers into those who can afford to spend a great deal of money, and those whose are more price sensitive.
Understand prevailing trends. Nowadays the trends in some industries like fashion are challenging to follow as they change too rapidly. With micro-segmentation in color and brands, a business can better observe what colors are trending now. Is it black? Which brands are browsed more often than others? What category of products attracts the most attention when there is a spike in viewed items?
Boost customer loyalty.You can do some great things with personalization since your campaigns turn out to be more meaningful; e.g. reward programs tailored to the needs of each segment will make your customers feel that they matter to your business, which in turn will increase customer loyalty and retention.
Offer Relevant Selections.A big part of the e-commerce success formula is to effectively match up the right product to the right customer. With micro-segmentations, you can estimate “recommendation handrails” for the recommendation engines with which to speed up the learning process of your algorithms. For instance, consider the price interval affinity. Exponea can use this to split up the recommendation engines into 2-7 different engines based on the pattern of price intervals your customers and then serve them custom each to the 7 different segments directly on the site, web-layers or in email communication.
Opportunities for Automation & Personalisation
Recommendations targeting. Exponea’s Tag Manager is capable of passing information to a Facebook Pixel or a Google G-tag; such as the membership of a cookie to a given customer micro-segment. This could enable better targeting on Facebook Ad and Google Ad platforms.
Newsletter/web-layer personalization.Emails that are tailored for a certain pre-determined audience with similar needs lead to higher conversion rates. For instance, customers interested in specific brands will receive newsletters with discounts/new products/back in stock or other relevant information regarding these particular brands. Also, a web-layer could pop-up for returning visitors to your website showing one of the most viewed products during their previous session.
Jinja personalization. This templating language is a powerful addition to other personalization tools in Exponea, such as web layers, Experiments, and various campaigns. It can personalize the subject line or the content based on customer data stored in the database.
Retargeting to customers. Create marketing automation scenarios that reach out to groups of customers and present personalized messages to them.
Web personalization. You can personalize the web experience based on micro-segments, e.g for one group of customers the blocks with particular categories in which they have shown interest can be highlighted to draw more attention to them, while for others, the deals/discounts of their most browsed brand can be shown on the homepage of the site.
Part 3
How do you implement the solution in Exponea?
We will show you how to create a basic segmentation as well as a scenario. To do this, we’ll use an Aggregate and a Segmentation in Exponea. To get meaningful insights from this analysis, you need at least 2 months of data.
Creating segmentation
Initially, we need to create an Aggregate to calculate aggregated information for every customer, which will then be used by the Segmentation.
1. Create an aggregate. It can be done in two ways:
- Go to Data & Assets > Data manager > Definitions > New definition.
- Aggregates/running aggregates can also be created when selecting customer attributes/events for your analysis wherever it is possible. If you wish, you can also save them for later use (so next time it appears in the list) by clicking on the save button.
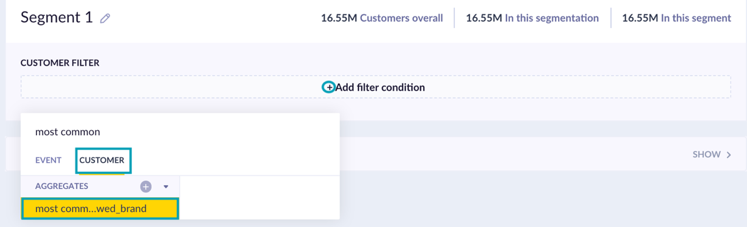
Select the event with which you want to calculate the aggregate. For example, Most common > view_item calculates the items most commonly viewed by the customer.
You can specify the metric further by adding an attribute of the event. For instance, the most common > view_item > brand will return the most viewed brands.
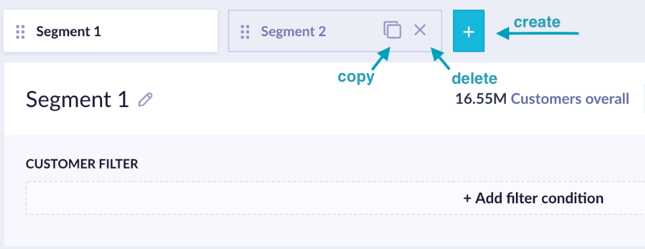
2.Create the segments.
Create a new segment by clicking on the blue + sign next to the tabs.
Edit an existing segment by clicking on a tab.
Hover your mouse pointer over a tab to reveal a copy sign and x sign.
Click on the copy sign to duplicate the segment.
Click on the x sign to delete the segment.
Define each segment using customer filters. Click on + add filter condition. Under the customer tab select aggregate created in the previous step – most_common_view_item_brand
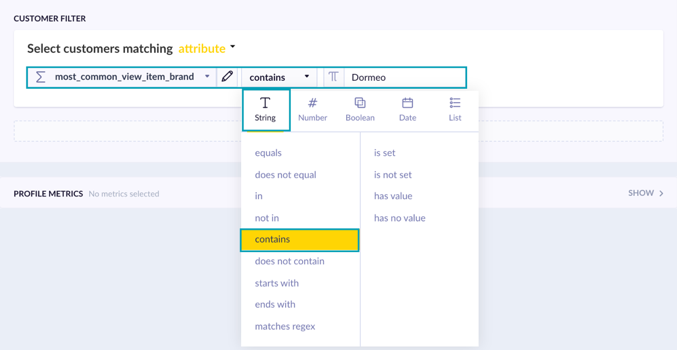
Choose “contains operator” which is under the string tab; also select the brand.
Create at least 5 segments, one for each of the brands you want to estimate.
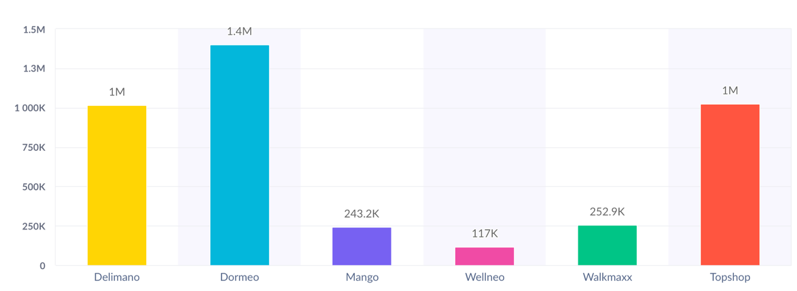
The final set up of the report

Part 4
Insights
In this section we would like to show you examples of possible micro-segmentations.
Micro-segmentation: brand
Micro-segmentation: category
Micro-segmentation: price